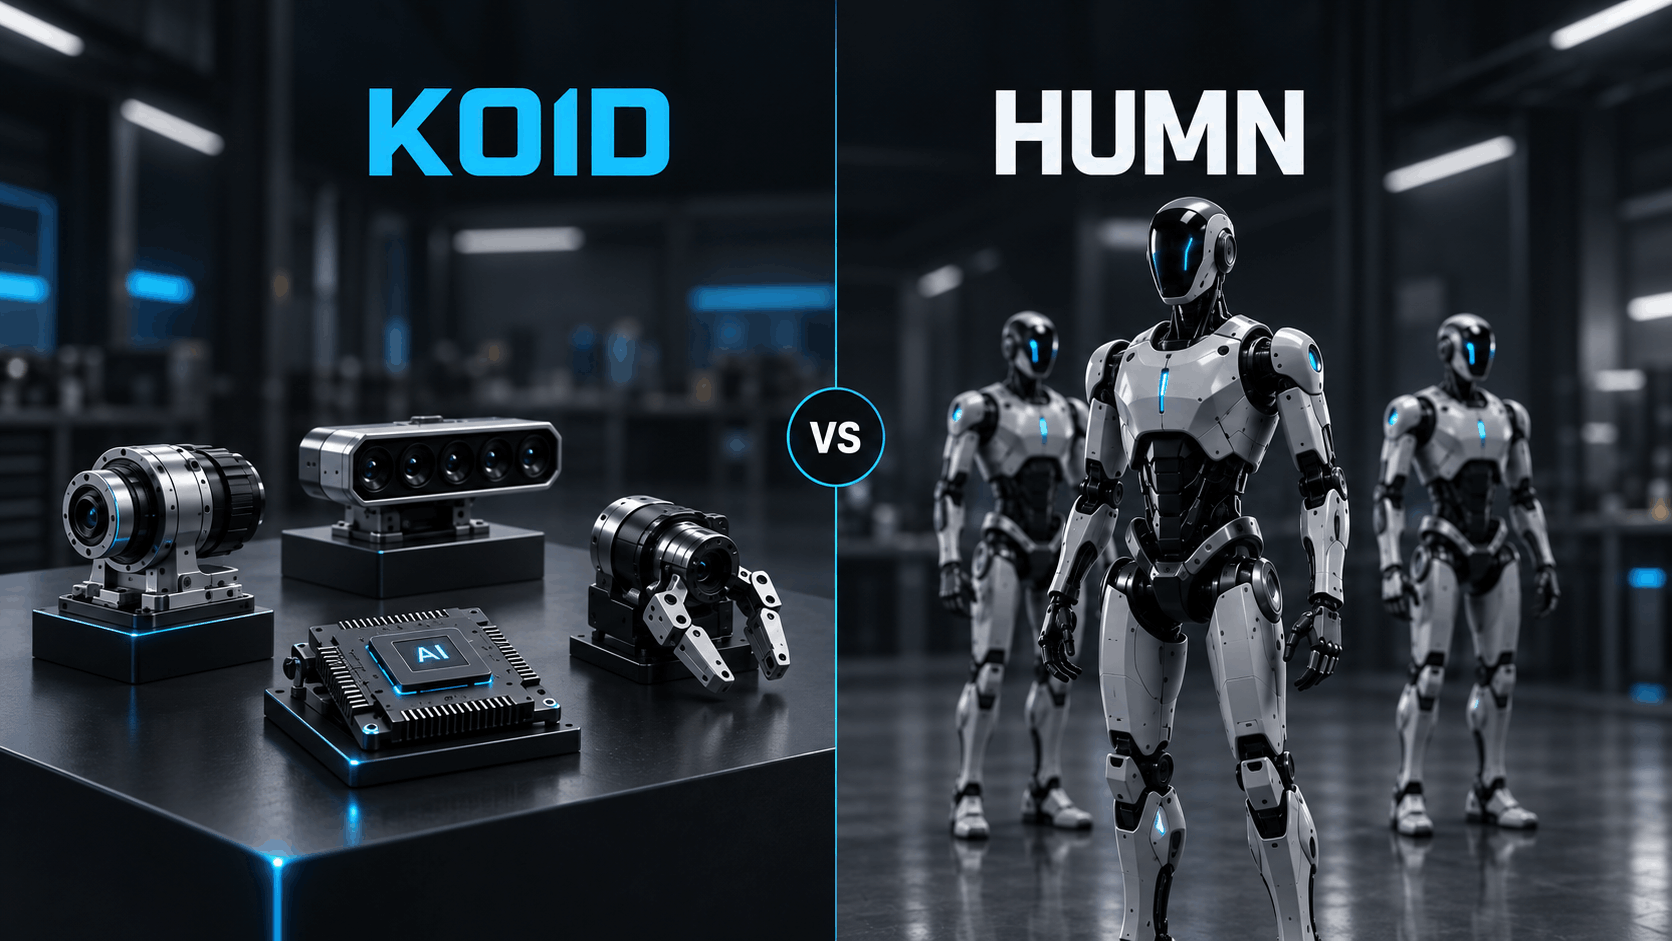
KOID and HUMN own the same humanoid robotics theme through opposite constructions. KOID, the KraneShares Global Humanoid Robotics and Physical AI Index ETF, equal-weights 60 stocks across the humanoid supply chain at a 0.69 percent net expense ratio. HUMN, the Roundhill Humanoid Robotics ETF, is actively managed: its Investment Committee picks 44 positions and weights the largest toward humanoid makers, at a 0.75 percent expense ratio.
KOID wins on net cost, size, and diversification. HUMN wins on direct exposure to humanoid makers and the speed of active management. Fifteen months of history is enough to compare holdings, concentration, and cost, but not enough for a track-record verdict: neither fund has been through a full market cycle or a real drawdown. The better fund depends on how an investor wants to own the theme: the humanoid supply chain by rule, or the humanoid makers by hand. The comparison below covers holdings, overlap, fees, performance, risk, and investor fit.
See how KOID and HUMN stack up against the rest of the field on our ETF Tracker.
KOID vs HUMN Comparison Table
KOID and HUMN differ most on structure, concentration, and fees, while their trading spreads are nearly identical. Figures are as of September 17, 2026 unless a row states another date.
| Attribute | KOID | HUMN |
| Full legal name | KraneShares Global Humanoid Robotics and Physical AI Index ETF | Roundhill Humanoid Robotics ETF |
| Structure | Index-tracking, equal weight | Actively managed |
| Index or selector | MerQube Global Humanoid Robotics and Physical AI Index | Investment Committee |
| Inception | June 4, 2025 (first trade June 5) | June 26, 2025 |
| Expense ratio | 0.79% gross, 0.69% net through Aug 1, 2028 | 0.75% |
| Net assets | $334.85M | $91.79M |
| Holdings count | 60 (Aug 31, 2026) | 44 |
| Top ten concentration | 23.72% | 41.74% |
| Largest position | Hexagon, 2.62% | Tesla, 5.94% |
| 30-day median bid/ask spread | 0.18% | 0.19% |
| Listed options | Not stated on issuer page | Yes |
| 1-year NAV return (Jun 30, 2026) | 59.01% | 40.59% |
June 30, 2026 is the only date on which both issuers publish a matched return. The sections below explain the rows, starting with what each fund holds.
What Does KOID Hold?
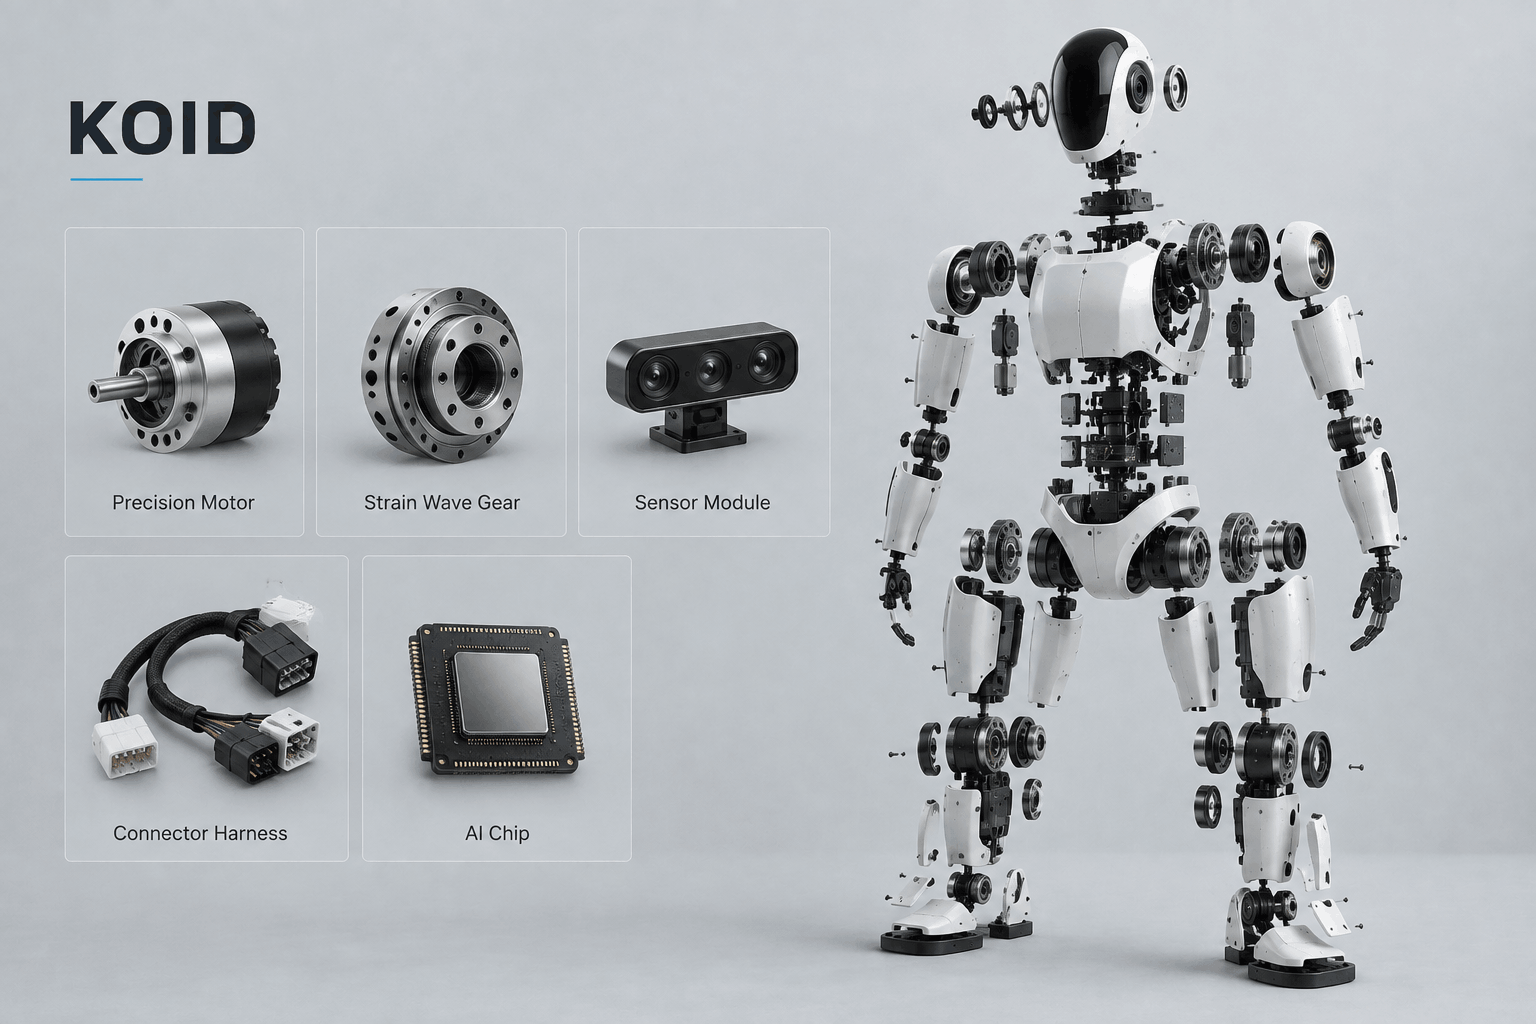
KOID holds 60 equal-weighted stocks selected by the MerQube Global Humanoid Robotics and Physical AI Index, spread across the humanoid supply chain. The index screens more than 3,000 global stocks down to 800-plus candidates, scores each for humanoid exposure, and equal-weights the final selection, so no single company decides the fund’s outcome.
KOID Top 10 Holdings
KOID’s ten largest positions each sat between 2.19 and 2.62 percent of assets on September 17, 2026.
| Holding | Weight | Business |
| Hexagon | 2.62% | Sensors and metrology |
| Doosan Co | 2.55% | Industrial conglomerate |
| Nidec | 2.39% | Precision motors |
| Allient | 2.38% | Motion control |
| Rainbow Robotics | 2.34% | Humanoid developer |
| Symbotic | 2.33% | Warehouse automation |
| Magna International | 2.31% | Contract manufacturing |
| TE Connectivity | 2.31% | Connectors and sensors |
| Nvidia | 2.30% | AI compute |
| Amphenol | 2.19% | Interconnects |
Rainbow Robotics is the only humanoid maker in KOID’s top ten. The other nine span sensors, motors, motion control, connectors, AI compute, warehouse automation, and industrial manufacturing.
What Does HUMN Hold?
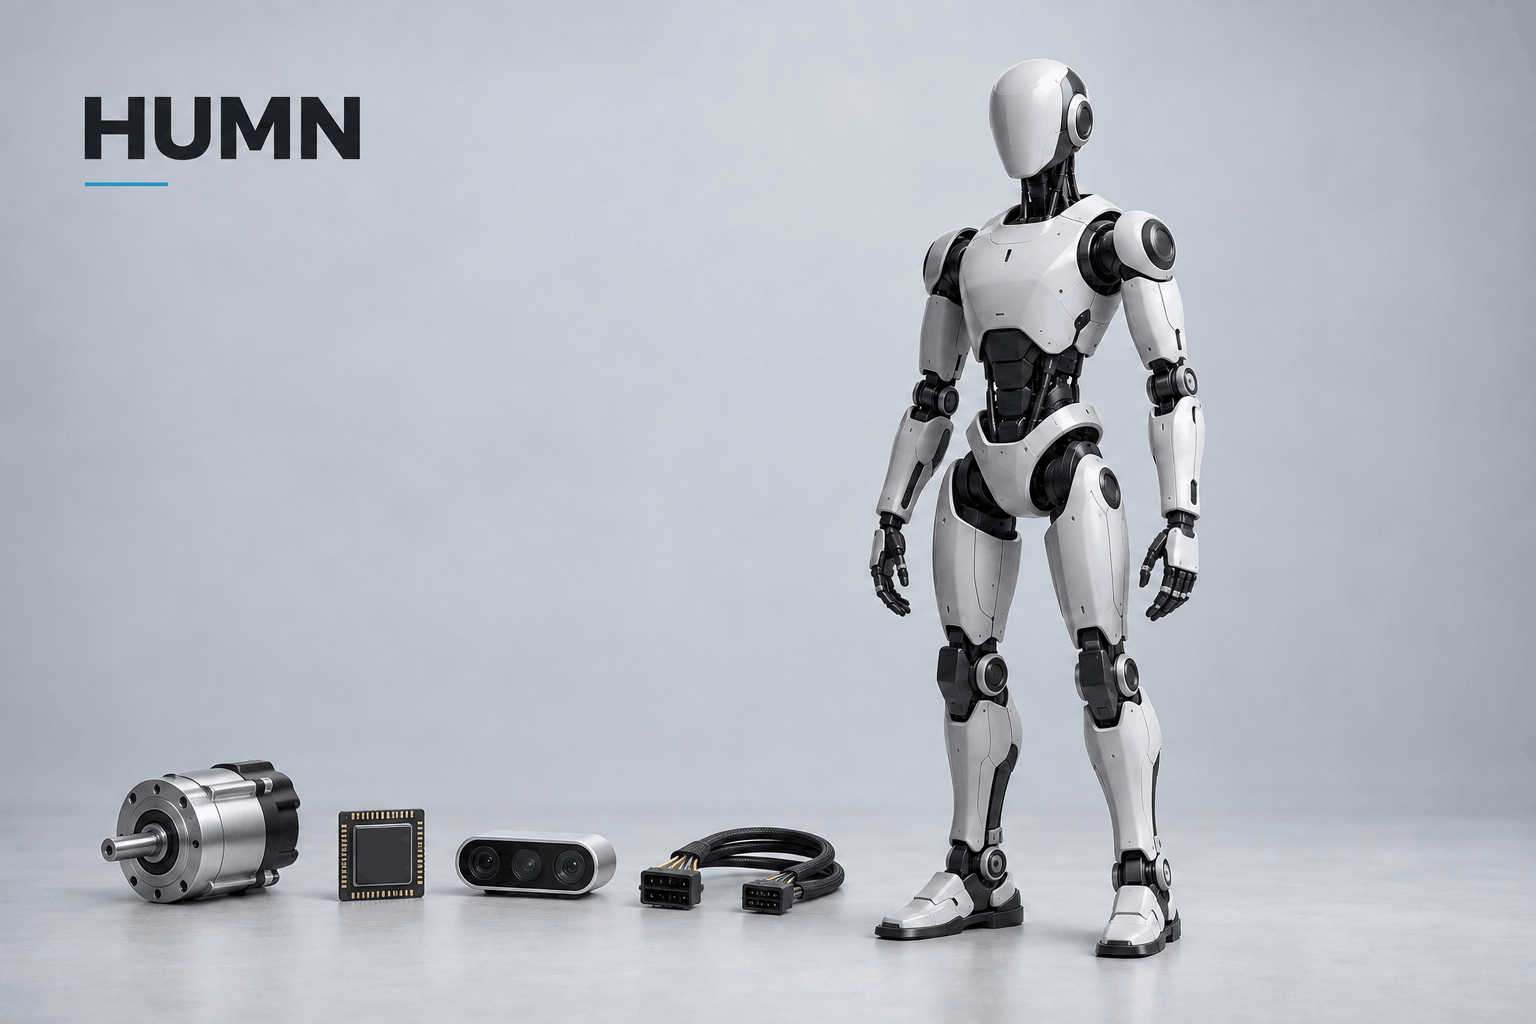
HUMN holds 44 positions chosen by Roundhill’s Investment Committee, with its largest weights in the companies building humanoid robots. Where KOID follows index rules, the committee sizes each position by conviction, which put Tesla first at 5.94 percent on September 17, 2026.
HUMN Top 10 Holdings
HUMN’s ten largest positions ranged from 2.97 to 5.94 percent of assets on September 17, 2026, and together held 41.74 percent.
| Holding | Weight | Business |
| Tesla | 5.94% | Optimus program |
| Harmonic Drive Systems | 5.35% | Strain wave gears |
| Unitree (via total return swap) | 4.86% | Humanoid maker |
| UBTech Robotics | 4.59% | Walker humanoids |
| Rainbow Robotics | 4.31% | Humanoid developer |
| Robotis | 4.30% | Actuators and platforms |
| Leader Harmonious Drive Systems | 3.39% | Harmonic reducers |
| Doosan Robotics | 3.04% | Collaborative robots |
| Nvidia | 2.99% | AI compute |
| Hyundai Motor | 2.97% | Boston Dynamics parent |
Tesla, Unitree, UBTech Robotics, Rainbow Robotics, and Hyundai Motor put 22.67 percent of HUMN’s assets into humanoid makers and their parents within the top ten alone, against 2.34 percent for KOID. The other five supply gears, reducers, actuators, collaborative robots, and AI compute, so HUMN owns the supply chain too but weights the makers first.
HUMN’s Unitree Position
HUMN held a 4.86 percent Unitree position on September 17, 2026, 29 days after Unitree listed on the Shanghai STAR Market on August 19. The position ranked third in the fund and sits in a total return swap on Yushu Technology, Unitree’s Chinese company name, because STAR Market shares are difficult for US funds to hold directly. KOID’s top ten showed no Unitree position, since an index adds new listings only at reconstitution. Unitree’s valuation and backers sit in our humanoid robotics funding tracker.
How Much Do KOID and HUMN Overlap?
KOID and HUMN overlap on only two top-ten holdings: Rainbow Robotics and Nvidia. The small overlap follows from the two constructions: rules spread KOID across the supply chain, while the committee stacks HUMN toward the makers. Watch for one near-match: KOID holds Doosan Co, the parent conglomerate, while HUMN holds Doosan Robotics, the listed subsidiary. The full holdings files on both issuer pages show any overlap below the top ten.
KOID vs HUMN: Expense Ratio, Size, and Liquidity
KOID costs less to own today, at 0.69 percent net against HUMN’s 0.75 percent, but that edge rests on a fee waiver that runs until August 1, 2028. If the waiver lapses, KOID’s 0.79 percent gross rate makes HUMN the cheaper fund. KOID also held about 3.6 times HUMN’s assets on September 17, 2026, yet the two trade at nearly identical cost: 30-day median bid/ask spreads were 0.18 percent and 0.19 percent.
KOID vs HUMN Performance
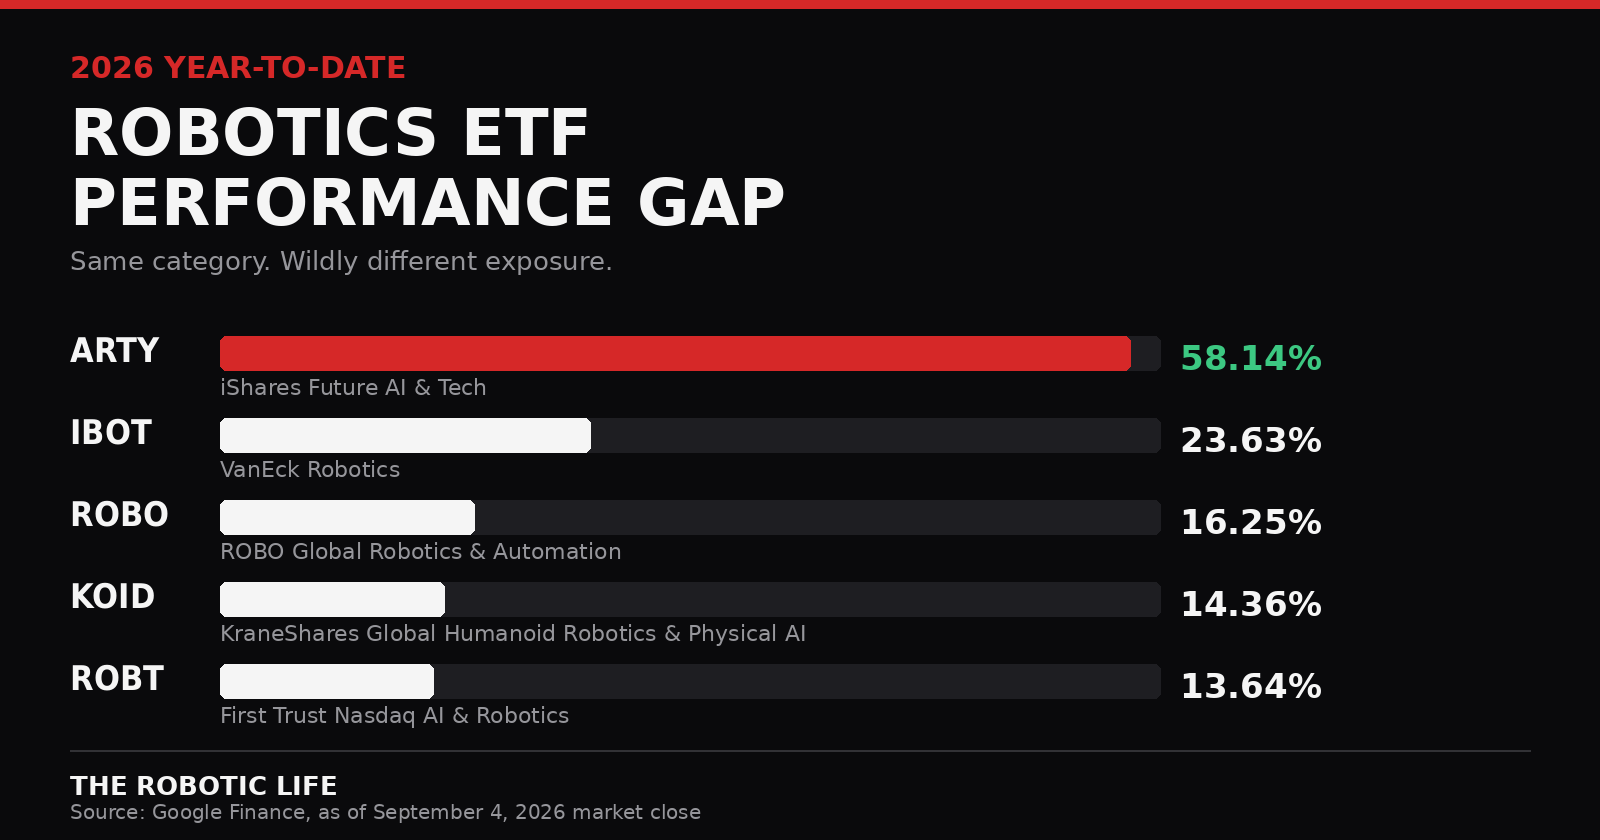
Fifteen months of history is too short for a track-record verdict on KOID or HUMN, because neither fund has been through a full market cycle or a real drawdown test. The one matched figure both issuers publish is the one-year NAV return to June 30, 2026: 59.01 percent for KOID and 40.59 percent for HUMN. A first year in a theme this narrow reflects sentiment toward humanoids more than either fund’s design, so this comparison rests on construction and risk. Category-wide returns sit in our robotics ETF performance gap analysis.
Which Is Riskier, KOID or HUMN?
HUMN is the riskier fund by concentration, while KOID carries the risk of rules that cannot react between index reconstitutions. Both risk profiles mirror the construction split: discretion concentrates exposure, and rules dilute it.
KOID’s Main Risks
KOID’s main risk is rigidity: its index rules cannot rotate away from a deteriorating holding between reconstitutions. Equal weighting also dilutes any single winner. China made up 24.31 percent of the fund on August 31, 2026.
HUMN’s Main Risks
HUMN’s main risk is concentration: its top ten held 41.74 percent of assets on September 17, 2026, against 23.72 percent for KOID’s. China made up 31.30 percent of HUMN on June 30, 2026, and mid caps 47.11 percent. The Unitree swap adds counterparty risk, which HUMN’s prospectus discloses.
Which HUMN Holdings Sell Humanoid Robots Today?
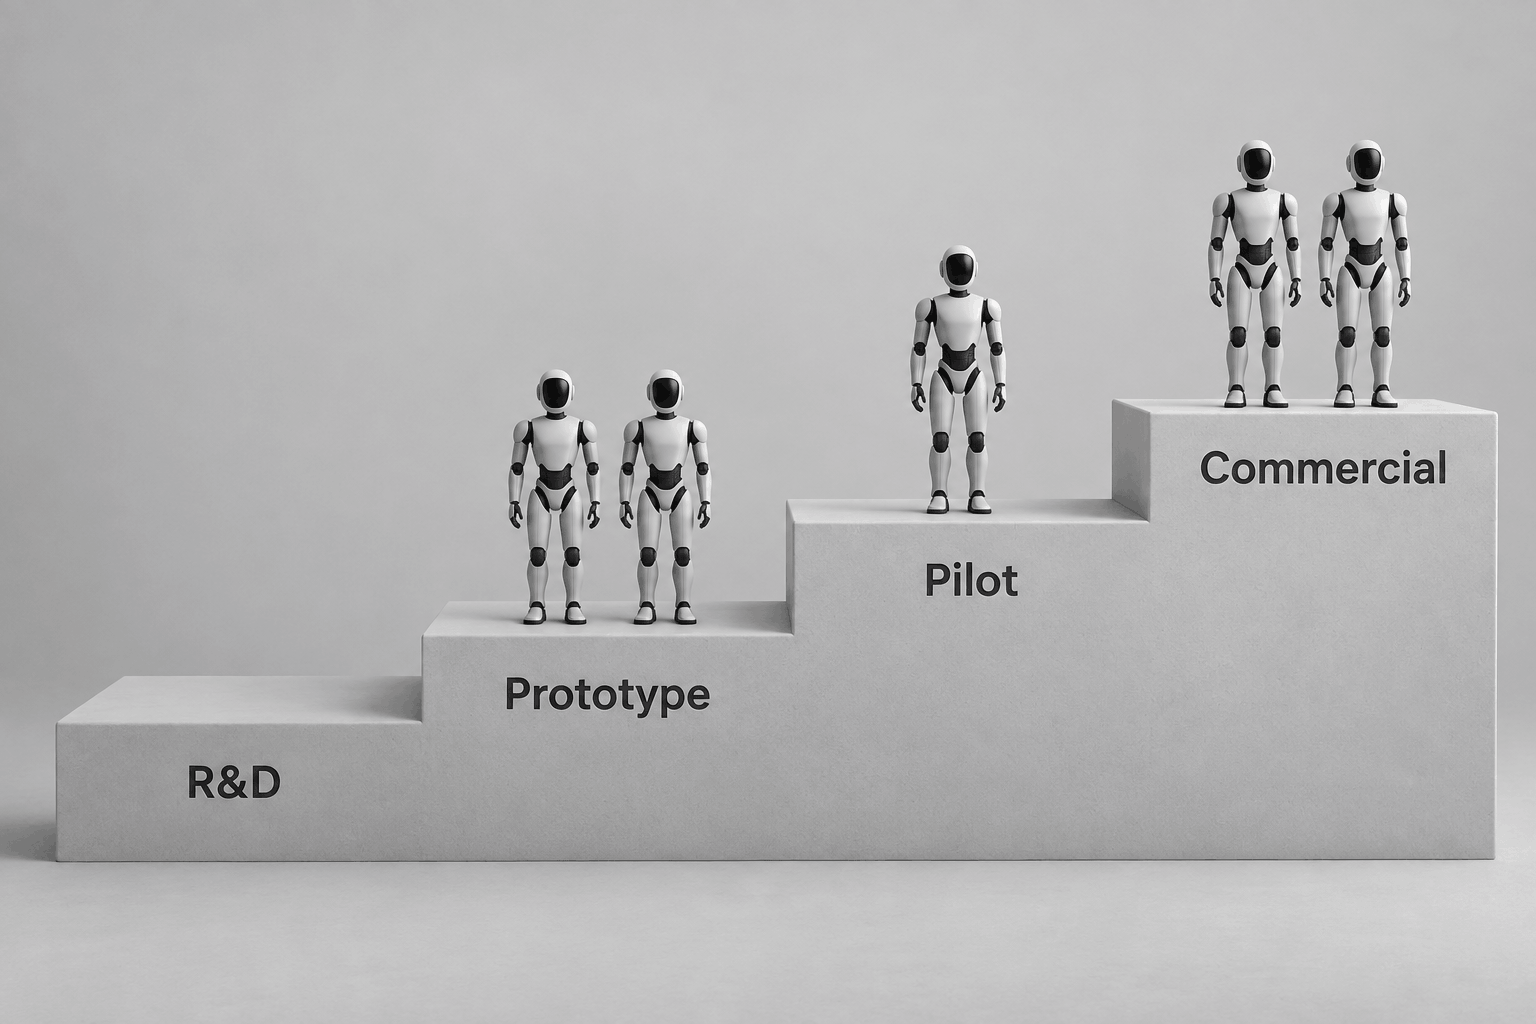
Only Unitree and Rainbow Robotics, two of HUMN’s five humanoid-linked top-ten holdings, sell humanoid robots commercially today. The Robotic Life’s humanoid robot companies directory places Tesla’s Optimus and Boston Dynamics’ Atlas at the Prototype stage (demonstrated but not sold) and UBTech’s Walker S2 at the Pilot stage (running at customer sites under trial).
| Holding | Humanoid platform | Stage | HUMN weight | KOID weight |
| Tesla | Optimus | Prototype | 5.94% | Not in top ten |
| Unitree | G1 | Commercial | 4.86% | Not in top ten |
| UBTech Robotics | Walker S2 | Pilot | 4.59% | Not in top ten |
| Rainbow Robotics | RB-Y1 | Commercial | 4.31% | 2.34% |
| Hyundai Motor (Boston Dynamics) | Atlas | Prototype | 2.97% | Not in top ten |
By weight, 13.50 percent of HUMN’s assets sit in makers whose humanoid is still at Prototype or Pilot, a program risk that KOID’s supply chain holdings largely avoid.
KOID or HUMN: Which One Fits Your Portfolio?
KOID fits a rules-first investor who wants the humanoid supply chain, and HUMN fits a conviction-first investor who wants the humanoid makers. The deciding question is how much single-company and program risk an investor accepts.
Choose KOID for near-equal weights across 60 positions, no manager judgment, and a 0.69 percent net fee set through August 1, 2028.
Choose HUMN for direct exposure to humanoid makers and a committee that moves fast, accepting a top ten that holds 41.74 percent of assets.
Does Holding Both KOID and HUMN Make Sense?
Holding both KOID and HUMN duplicates little at the top-ten level, where only Rainbow Robotics and Nvidia appear in both. Overlap below the top ten can differ, so the full holdings files on both issuer pages decide how much a combined position doubles up.
Alternatives to KOID and HUMN
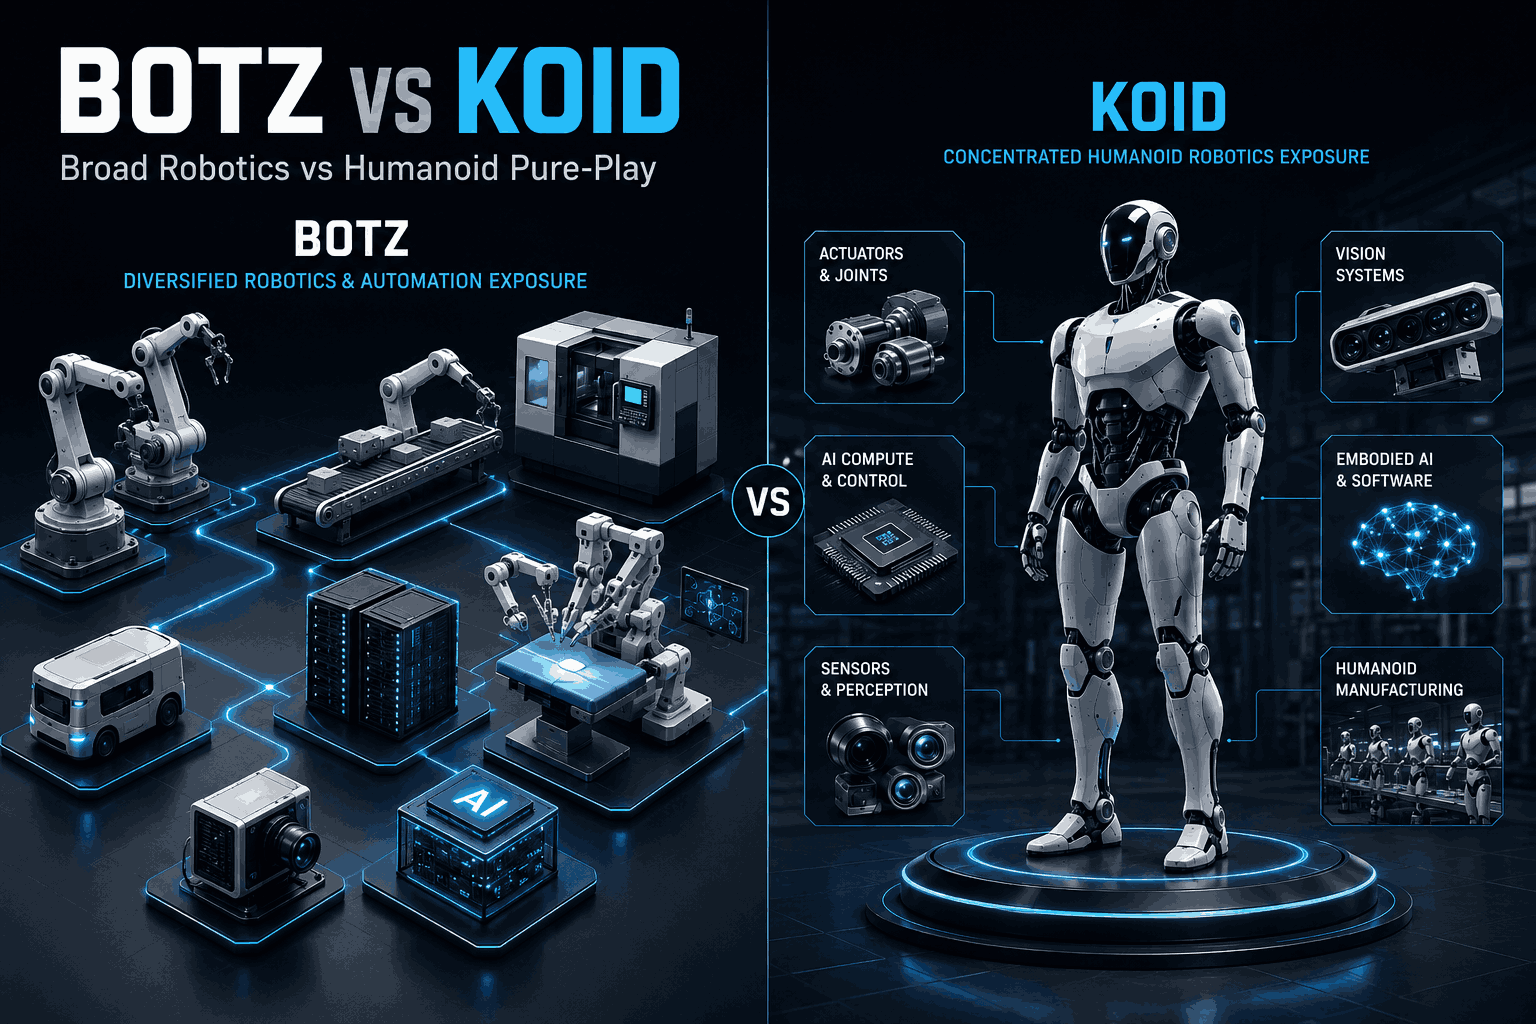
The main alternative to a humanoid pure-play is a broad robotics fund such as BOTZ, which holds automation broadly with humanoids as one slice rather than the mandate. Our BOTZ vs KOID comparison breaks down that decision, and ARTY vs IBOT weighs an AI compute fund against an industrial robotics fund.
Watch: The Robotic Life’s rundown of five robotics ETFs covers the wider fund landscape.

Key Takeaways
KOID and HUMN split the humanoid theme into rules and discretion, and every other difference follows from that split.
- KOID equal-weights 60 positions; HUMN’s committee picks 44, led by humanoid makers.
- KOID is cheaper on net fees until the August 1, 2028 waiver expiry.
- Only Rainbow Robotics and Nvidia appear in both top tens.
- HUMN built a 4.86 percent Unitree position within 29 days of the listing.
- Fifteen months of data supports a construction comparison, not a track-record verdict.
Confirm live figures on the KraneShares KOID page and the Roundhill HUMN page before any purchase, and see all eleven tracked funds in The Robotic Life’s Robotics ETF Directory.
Frequently Asked Questions
Is KOID or HUMN better?
Neither fund is better in absolute terms. KOID suits rules-based, equal-weighted exposure to 60 humanoid and supply chain stocks at 0.69 percent net, while HUMN suits concentrated, actively managed exposure to humanoid makers at 0.75 percent.
What is the HUMN ETF?
HUMN is the Roundhill Humanoid Robotics ETF, an actively managed fund that launched on June 26, 2025 and trades on Cboe BZX. Its Investment Committee held 44 positions on September 17, 2026, led by Tesla at 5.94 percent, and the fund charges a 0.75 percent expense ratio.
Which was the first humanoid robotics ETF?
KOID began trading on June 5, 2025, and HUMN followed on June 26, 2025. Both issuers describe their fund as the first US-listed humanoid ETF, and the launches sit three weeks apart.
Can KOID or HUMN hold Figure AI?
No. Figure AI, the maker of the Figure 03 humanoid, is a private company, and both funds hold listed securities only.
Disclaimer
The Robotic Life provides informational coverage of robotics companies, funds, and industry developments. Nothing in this article constitutes investment advice, a recommendation, or an offer to buy or sell any security. Fund figures change; confirm all data on the official issuer pages before making decisions. Readers considering financial decisions should consult a qualified financial advisor.
Sources
- KraneShares, KOID fund page: fund details, holdings, performance, and spread
- KraneShares, KOID fact sheet, August 31, 2026: holdings count and country weights
- Roundhill Investments, HUMN fund page: fund details, holdings, performance, spread, and options
- Roundhill Investments, HUMN fact sheet, June 30, 2026: geography and market cap weights
- The Robotic Life, humanoid robot companies directory: humanoid deployment stages
- The Robotic Life, Robotics ETF Directory: the eleven-fund robotics and humanoid ETF dataset, reviewed quarterly