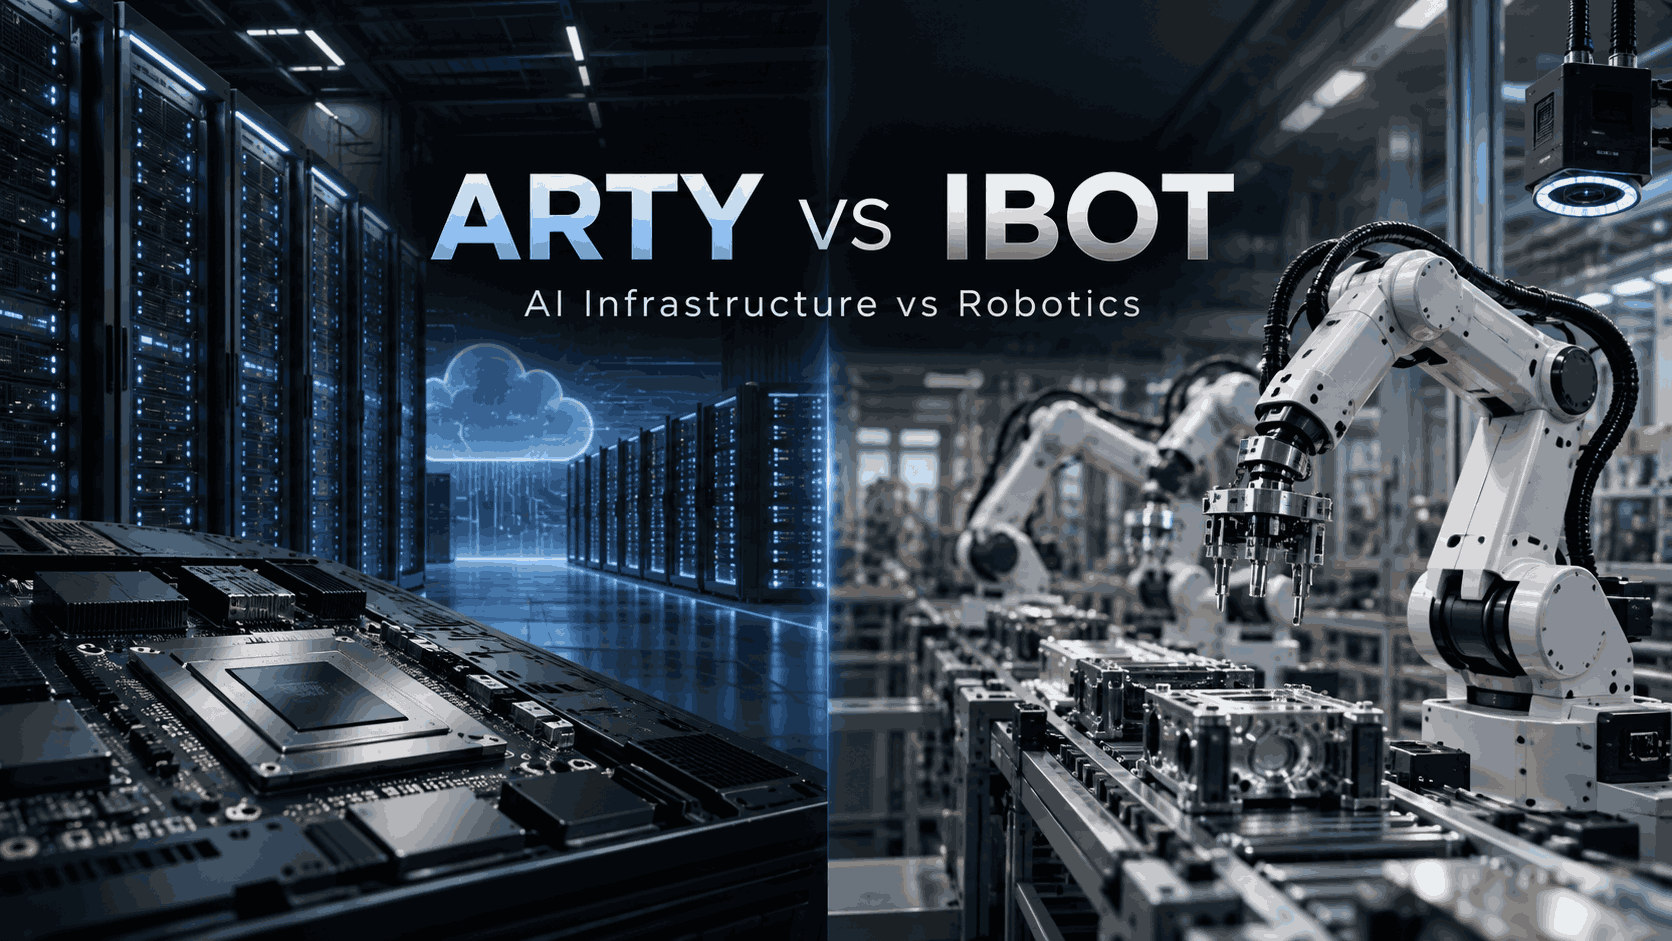
Only one of these two funds is a robotics ETF, and it is not the larger one. The iShares Future AI & Tech ETF (ARTY) tracks the Morningstar Global Artificial Intelligence Select Index. The VanEck Robotics ETF (IBOT) tracks the BlueStar Robotics Index. That index requires portfolio companies to earn at least 50 percent of revenue from robotics and automation.
Both funds charge 0.47 percent, so cost does not separate them. What separates them is what they own. The comparison below covers holdings, index rules, fees, liquidity, yield, and risk, using published issuer figures.
ARTY vs IBOT Comparison Table
The table compares ARTY and IBOT on issuer, index, cost, size, composition, and return, with each figure dated by its issuer.
| Attribute | ARTY | IBOT |
| Issuer | iShares, BlackRock | VanEck |
| Full legal name | iShares Future AI & Tech ETF | VanEck Robotics ETF |
| Former ticker | IRBO, changed August 12, 2024 | Not applicable |
| Inception | June 26, 2018 | April 5, 2023 |
| Index tracked | Morningstar Global Artificial Intelligence Select Index | BlueStar Robotics Index |
| Revenue threshold | None stated | At least 50 percent from robotics and automation |
| Expense ratio | 0.47 percent | 0.47 percent |
| Assets under management | $4.07 billion (Sep 9, 2026) | $100.63 million (Sep 9, 2026) |
| Holdings count | 49 (Sep 8, 2026) | 69 (Sep 8, 2026) |
| Top ten concentration | 42.31 percent | 41.09 percent |
| Core focus | AI infrastructure, semiconductors, cloud | Industrial automation, machine vision, robotics hardware |
| Robotics exposure | Indirect | Direct and mandated |
| 30-day SEC yield | 0.18 percent (Jul 31, 2026) | 0.60 percent (Sep 9, 2026) |
| Return, year to date | 59.27 percent (Sep 8, 2026) | 21.73 percent (Sep 09, 2026) |
The two issuers publish performance on different schedules, which is why the return dates differ.
What ARTY Holds: An AI Infrastructure Fund

ARTY tracks an artificial intelligence index, and nine of its ten largest positions are semiconductor or cloud companies. The fund launched in June 2018 and held 49 positions as of September 8, 2026.
ARTY top ten holdings
| Holding | Weight | Business |
| NVIDIA | 4.88% | AI compute |
| Taiwan Semiconductor Manufacturing | 4.76% | Contract chip fabrication |
| Micron Technology | 4.62% | Memory and high-bandwidth memory |
| Advanced Micro Devices | 4.52% | CPUs and GPUs |
| Super Micro Computer | 4.34% | AI server hardware |
| CoreWeave Class A | 4.24% | GPU cloud infrastructure |
| Broadcom | 4.11% | Networking and custom silicon |
| Global Unichip | 3.79% | ASIC design services |
| NAVER | 3.65% | Search and AI platform |
| Marvell Technology | 3.40% | Data center silicon |
These ten account for 42.31 percent of the fund. Not one of them is a robotics manufacturer.
The 2024 rename that changed the mandate
ARTY traded as IRBO until August 12, 2024, under the name iShares Robotics and Artificial Intelligence Multisector ETF. On that date the fund changed its name, its ticker, and its benchmark. The index moved from a robotics and artificial intelligence benchmark to the Morningstar Global Artificial Intelligence Select Index. Weighting shifted from equal weight to market capitalization weight. The expense ratio stayed at 0.47 percent. An investor who bought the fund for robotics exposure before that date now holds a different portfolio.
What IBOT Holds: The 50 Percent Revenue Rule
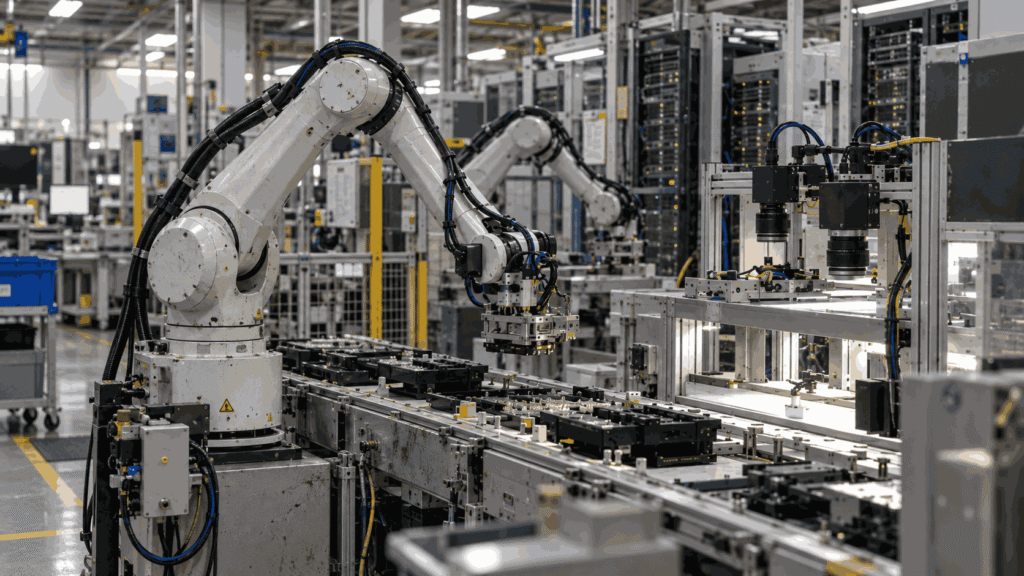
IBOT tracks the BlueStar Robotics Index, which requires portfolio companies to earn at least 50 percent of revenue from robotics and automation. That rule shows up in the sector split. Industrials accounted for 43.32 percent of the fund and information technology for 51.37 percent as of August 31, 2026. Country exposure ran 41.60 percent United States, 23.25 percent Japan, and 8.13 percent Switzerland.
IBOT top ten holdings
| Holding | Weight | Business |
| Nvidia | 5.56% | AI compute |
| Keyence | 5.48% | Factory sensors and machine vision |
| Emerson Electric | 5.48% | Industrial automation systems |
| ASML Holding | 5.00% | Lithography equipment |
| ABB | 4.93% | Industrial robots and automation |
| Autodesk | 3.64% | Design and manufacturing software |
| Rockwell Automation | 3.55% | Factory control systems |
| TechnipFMC | 2.61% | Subsea robotic systems |
| Fanuc | 2.56% | Industrial robot arms |
| Teledyne Technologies | 2.28% | Imaging and sensing |
These ten account for 41.09 percent of the fund.
The one humanoid manufacturer in the book
IBOT holds UBTech Robotics at 1.13 percent as of September 8, 2026. The Hong Kong listed company builds the Walker humanoid line. ARTY holds no humanoid manufacturer at any weight. Valuation and backer detail for UBTech and its peers sits in our humanoid robotics funding tracker.
How Much Do ARTY and IBOT Overlap?
Nvidia is the only company that appears in both funds’ top ten holdings. The two funds are almost equally top-heavy. ARTY’s top ten account for 42.31 percent and IBOT’s for 41.09 percent, a gap of 1.22 points. Concentration is not what separates them.
Composition is. ARTY’s ten are chip designers, memory makers, server builders, and cloud providers. IBOT’s ten are factory sensors, robot arms, control systems, and lithography equipment.
Holding both is not diversification inside one theme. It is two separate bets that share a single stock.
ARTY vs IBOT on Fees, Size, Liquidity, and Yield
Both funds charge 0.47 percent, which removes cost from the decision.
| Attribute | ARTY | IBOT |
| Expense ratio | 0.47% | 0.47% |
| Net assets | $4.07B | $100.63M |
| 30-day median bid/ask spread | 0.11% | 0.23% |
| 30-day average volume | 461,919 | 15,765 |
| 30-day SEC yield | 0.18% | 0.60% |
| Distribution frequency | Semi-annual | Annual |
Size drives the trading difference. ARTY traded roughly 29 times the daily volume of IBOT at half the bid-ask spread. That gap matters for larger orders and regular contributions.
IBOT held $100.63 million as of September 9, 2026. Fund screens commonly treat assets below $50 million as elevated closure risk. IBOT sits above that line but remains a small fund.
Yield runs opposite to the direction most comparison tools report. IBOT posted a 30-day SEC yield of 0.60 percent against 0.18 percent for ARTY. IBOT distributes annually, while ARTY distributes twice a year.
The two funds also separated by roughly 34 points on year to date return. Dispersion of that size is normal across this category, and we break down the reasons in our robotics ETF performance analysis.
Which Carries More Risk, ARTY or IBOT?
The larger and better performing fund is also the more volatile one. ARTY carried a three-year equity beta of 1.95 and a three-year standard deviation of 31.94 percent as of July 31, 2026. IBOT carried a three-year beta of 1.43 against the S&P 500 and volatility of 21.31. Its Sharpe ratio was 0.84 as of August 31, 2026.
Valuation follows the same pattern. ARTY’s price to earnings ratio stood at 36.74 against 29.24 for IBOT.
IBOT carries a currency factor that ARTY does not. Roughly half its exposure sits outside the US dollar, led by 23.25 percent in Japanese yen. Its worst quarter since inception was a 10.06 percent decline in the third quarter of 2023.
ARTY or IBOT: Which Fits Which Investor
ARTY fits an investor buying the AI compute buildout, and IBOT fits an investor buying physical automation.
ARTY suits a reader who wants the semiconductor and cloud layer, accepts higher volatility, and values deep liquidity with a record running to 2018.
IBOT suits a reader who wants machinery, sensors, and factory automation specifically. That reader accepts a smaller and less liquid fund in exchange for a mandate that cannot drift into software.
The two can sit together without duplication, because only one holding overlaps. Position sizing, not fund selection, manages the volatility difference.
Which Robotics ETF Is Best in 2026?
Neither ARTY nor IBOT is a humanoid robotics fund, which is what most readers arriving at this comparison are looking for.
Of the two, only IBOT qualifies as a robotics fund by mandate. ARTY is an artificial intelligence fund that once carried a robotics name.
Humanoid pure-play exposure sits in a separate group of funds built for that thesis. Eleven US listed robotics and humanoid funds now trade, with expense ratios spanning a wide range. The full lineup sits in our robotics investing and ETF guide.
Key Takeaways: ARTY vs IBOT
ARTY and IBOT answer different questions, and only one of them is about robots.
- Only IBOT qualifies as a robotics fund by mandate, through a 50 percent revenue rule
- ARTY changed its name, ticker, index, and weighting method on August 12, 2024
- Fees tie at 0.47 percent, so the decision rests on what each fund owns
- Nvidia is the only holding shared between the two top tens
Confirm live figures on the issuer pages before any purchase, because assets, holdings, and yields change.
Frequently Asked Questions
Is ARTY a robotics ETF?
No. ARTY tracks the Morningstar Global Artificial Intelligence Select Index. Nine of its ten largest holdings are semiconductor or cloud companies, and no robotics manufacturer appears in the top ten.
What happened to IRBO?
IRBO became ARTY on August 12, 2024. The fund changed its name, ticker, and benchmark index, and moved from equal weighting to market capitalization weighting. The expense ratio stayed at 0.47 percent.
Which ETF has the higher dividend yield, ARTY or IBOT?
IBOT. Its 30-day SEC yield was 0.60 percent as of September 9, 2026, against 0.18 percent for ARTY as of July 31, 2026.
What is the difference between ARTY and IBOT?
Mandate. ARTY buys the artificial intelligence compute layer across semiconductors, memory, and cloud. IBOT buys companies earning at least half their revenue from robotics and industrial automation.
Is there a Vanguard robotics ETF?
No. Vanguard does not offer a robotics or humanoid robotics ETF. The funds in this category come from other issuers.
Disclaimer
The Robotic Life provides informational coverage of robotics companies, funds, and industry developments. Nothing in this article constitutes investment advice, a recommendation, or an offer to buy or sell any security. Fund figures change; confirm all data on the official issuer pages before making decisions. Readers considering financial decisions should consult a qualified financial advisor.
Sources
- iShares, ARTY fund page: expense ratio, net assets, holdings count, benchmark index, performance, and risk metrics
- VanEck, IBOT fund page: expense ratio, net assets, holdings, benchmark index, performance, and sector and country weightings
- iShares, ARTY fund fact sheet: the August 12, 2024 index change, which the issuer records as ARTY, formerly IRBO, moving off the NYSE FactSet Global Robotics and Artificial Intelligence Index
- MarketVector, BlueStar Robotics Index: the 50 percent revenue threshold, the seven eligible subthemes, and the modified market capitalization weighting